The customer is always right. This is the main rule of the retail, right? But how do you maintain a high level of customer satisfaction and know what your customers want before they think about it? After all, customer needs, market conditions and trends are constantly changing. In addition, there are countless other retail aspects in retail which require constant monitoring and analysis: customer satisfaction, sales efficiency, return policy, inventory management and more.
In retail industry, the right data helps you make the promptest and the most effective decisions at the right time. Unfortunately, combining, analyzing, and visualizing this data to get a clear picture of what is going on might seem like mission impossible.
As a business owner, you definitely want to drive more sales, reduce operating and customer acquisition costs, and provide a solidly great customer service. This is where the force of the Microsoft Power BI steps into the game. It allow you to create more accurate forecasts and complex multidimensional models, optimize inventory, as well as build loyalty and demand programs. With Power BI, data is presented in a clearly readable and easy-to-understand dashboard. Here, easily analyze data from a myriad of different sources in a single window boosted with an ultra-powerful, artificial intelligence-based interactive dashboard tools.
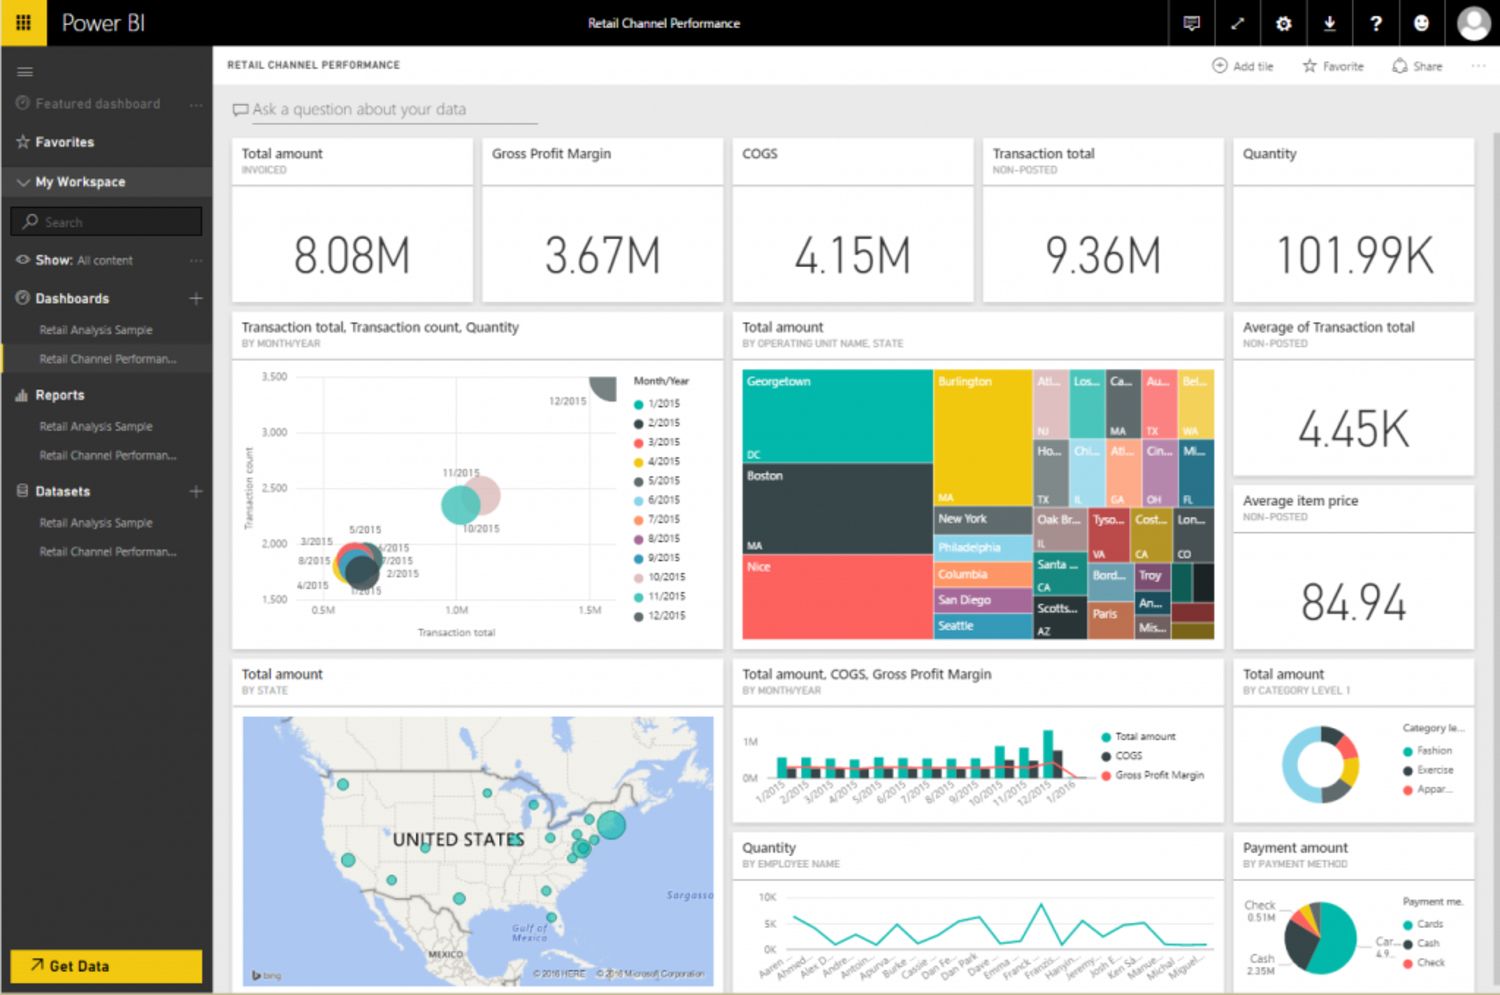
Power BI Retail Channel Performance dashboard. Source: Microsoft Docs portal.
See some turning examples of how Power BI can help in retail industry
Turnover
Monitor turnover metrics and evaluate both product sales effectiveness and overall organizational success as well as the sales performance. So, look boldly into the future with the reliable Power BI forecasts.
Different data sources
Control, manage, and link different processes from different data sources. From now on, you can access a comprehensive, centralized view of the report right from your browser window. Now and then, create detailed daily, weekly, or monthly reports in one window.
Large amount of data
Easily integrate large amounts of BIG-DATA data with the Power BI system. Process trillions of rows and petabytes of data that most existing platforms would not be able to handle nowadays. Unleash the power of BIG-DATA to get more accurate predictions and better solutions on an unlimited scale.
Setting MIN / MAX on your shelves
Automate stock replenishment by analyzing stock balances. Employ the potential of Power BI to generate orders as you approach the MIN limit, and monitor the situation in real time whether you are exceeding the MAX limit. From now on, no Out of Stock or excessive ordering.
Seasonality
Use artificial intelligence to determine the seasonal index and get reliable sales forecasts by estimating seasonality. Be prepared for the increased demand for goods by ordering additional quantities of seasonal goods.
Trading point attendance
Know exactly the ratio between the number of visitors to a trading point (a specific shop or branch) and the number of people who shopped there. Evaluate the effectiveness of ongoing sales or campaigns and the reaction of visitors to the changes in assortment or items’ layout.
Marketing effectiveness
Connect to hundreds of data sources and easily track the effectiveness of direct and digital advertising. See all your campaign metrics from Facebook, Twitter, Google, and many more sources in one place. Assess customer loyalty by analyzing the Customer Promotion Score (NET).
Write-off efficiency
Analyze obsolete or damaged goods, their groups, and acquire the data on the employees who write-off the most of such type of goods. Handling the most objective information, streamline your negotiations with suppliers on compensation for the written-off goods.
Work efficiency of the hall staff
Track sales results and accurately evaluate the work efficiency of each employee. More to that, prepare a product sales plan, and set reasonable KPIs for teams, divisions, and individual employees. Last but not the least, generate a plan-fact analysis to dig the insights on the department, employee, or period with objective evaluation. And for a boost up of your team spirit, enable healthy competition using gamification methods.
Perfect tool for retail industry is here!
Ensure smooth run of your business, and let the Power BI analytical tool smoothly process your complex data. Turn endless reports into one centralized one and accessible straight from your browser window. Foresee potential risks and respond quickly to unpredictable changes.
GO-ERP is a seasoned and well-trusted partner highly experienced in implementation, development and consultancy of Microsoft Dynamics 365 business applications. Thus, we have the right skills and resources to carry out projects of various scopes in Lithuania, Europe and the world. We know how to ensure smooth and efficient retail management. Said that, we manage BIG-DATA, Omnichannel, know-how technologies with excellence.
Contact us and we will not only offer the best solution for your business, take care of the integration of Power BI with the systems you are currently using, but we will also empower your management team to handle the data analytics of your department.